
Globalization is pushing companies to plan and operate more and more across the borders of their country of origin. This will have an impact global S&OP/IBP processes as well. In my previous blog (the fifth out of this serie from six) on this topic https://supplychaintrends.wordpress.com/2011/06/17/the-impact-of-company-culture-on-ibp-part-iv-geography-2/ I used Geert Hofstede’s ground breaking work on cultures to explore what could be preferred cultural drivers to implement and sustain IBP. According to my perception, those preferred cultural drivers are:
- High individualism
- Low power distance
- Low uncertainty avoidance
- Low masculanity
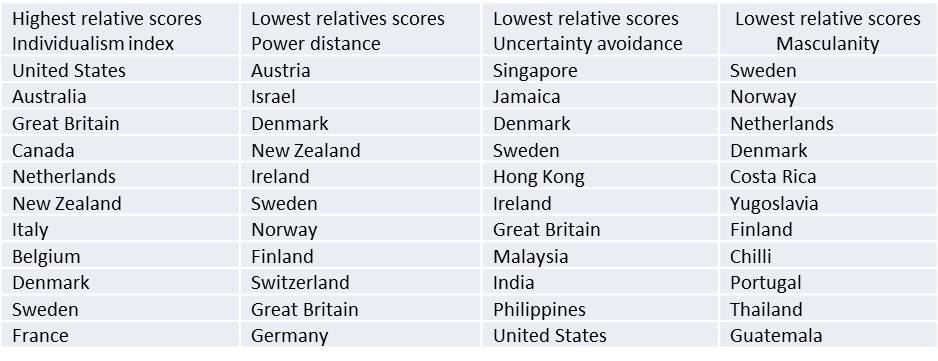
If we use these cultural preferences, we can assess what would be the preferred natural IBP environment from geographical perspective. On the website http://www.geert-hofstede.com/ you can check the scores on the four cultural drivers for over fifty countries. Using the scores from countries that relative to each other perform well against the preferred four cultural drivers, we get next table of 11 top performers:

If we give 11 point to the highest performer per cultural driver and 1 point to the lowest in this table and we take as further criteria that a country has to score in minimum two of the four preferred dominant cultural drivers we get next table:

Only two countries, Denmark and Sweden, score in the top eleven for all preferred cultural drivers. If we look at the geographies where the cultural drivers are most apparent then we might conclude that IBP has more likelihood to be successful in these countries. A daring hypothesis! If we believe this hypothesis to be true, the country with the most cultural advantage to implement and sustain IBP would be Denmark and the ultimate geography the Nordics.
As mentioned in my previous blog; there is a very strong argument that something complex as geographical and cultural impact on IBP can’t be captured in four dimensions. There are countless other factors that play a role in creating sustainable IBP environments. On the other hand, cultural impacted behaviour can’t really be excluded from the equation of an ideal cross geography IBP environment. If all the other parameters in this IBP equation are kept equal, it might be that countries with the preferred cultural drivers will have related behaviours that have a leading edge to create a sustainable IBP environment.

One thought on “The impact of company culture on IBP part VI: Geography 3”